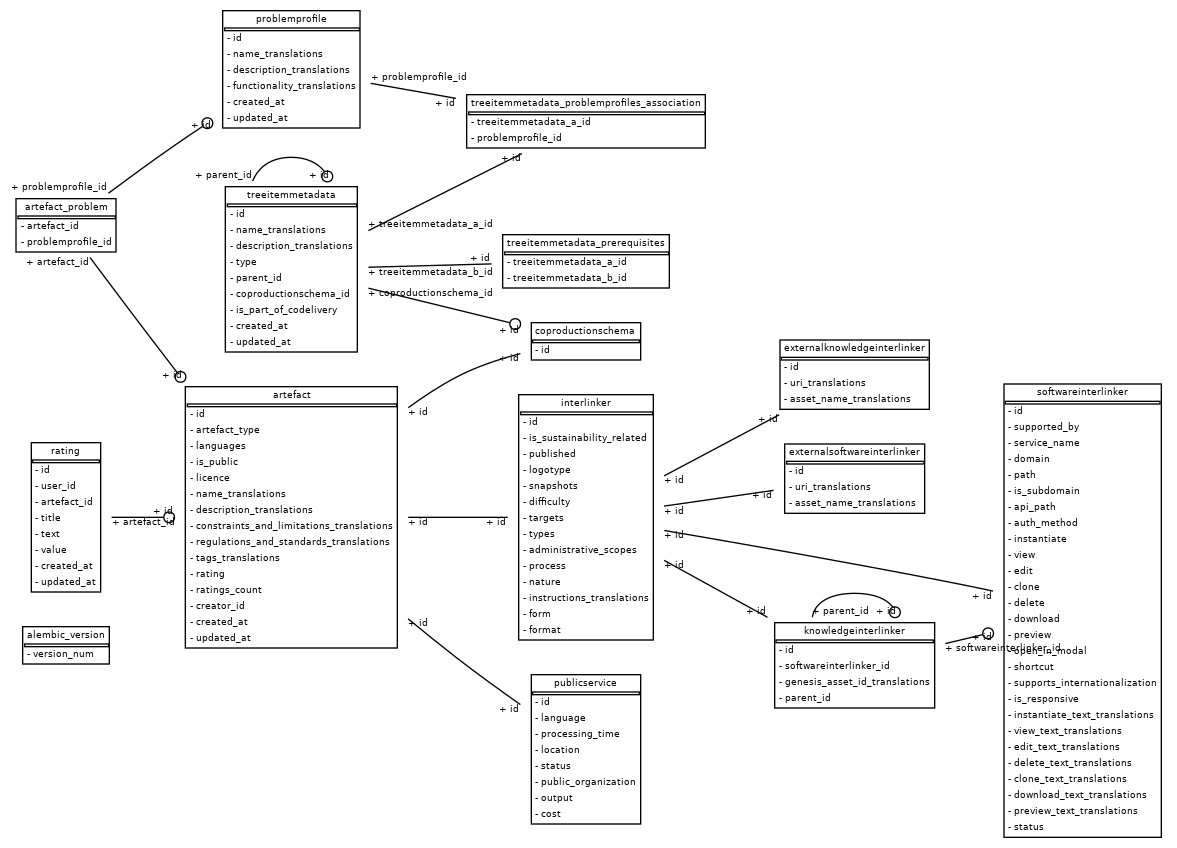
Current data models of the main components of the collaborative environment backend
Catalogue service

Coproduction service

How are these images generated
When the catalogue and coproduction services start in development mode (local environment only), the entrypoint script executes the development.py python script, which uses sqlalchemy_schemadisplay library to obtain the database schema from postgres and creates the images shown.
import logging
from app.general.db import base
# make sure all SQL Alchemy models are imported (app.general.db.base) before initializing DB
# otherwise, SQL Alchemy might fail to initialize relationships properly
# for more details: https://github.com/tiangolo/full-stack-fastapi-postgresql/issues/28
from app.general.db.base_class import Base as BaseModel
from app.general.db.session import SessionLocal, engine
from sqlalchemy import MetaData
from sqlalchemy_schemadisplay import create_schema_graph
from app.config import settings

logging.basicConfig(level=logging.INFO)
logger = logging.getLogger(__name__)

if __name__ == "__main__":
    # create the pydot graph object by autoloading all tables via a bound metadata object
    graph = create_schema_graph(
        metadata=MetaData(settings.SQLALCHEMY_DATABASE_URI),
        show_datatypes=False,  # The image would get nasty big if we'd show the datatypes
        show_indexes=False,  # ditto for indexes
        # From left to right (instead of top to bottom)
        rankdir="LR",
        concentrate=True,  # Don't try to join the relation lines together
    )
    graph.write_png("dbschema.png")  # write out the file